
 2 hours ago
549
2 hours ago
549


The post Bitcoin Breaks a Bear-Market Pattern—Why a 40% Crash Looks Increasingly Unlikely appeared first on Coinpedia Fintech News
After a largely consolidated weekend, Bitcoin price pushed higher and briefly reclaimed the $90,000 mark, signaling an attempt at a bullish yearly close. While the price continues to trade within its broader accumulation range, the bigger picture suggests a notable shift in market behavior. Bitcoin is showing signs of strength that are easy to overlook if one focuses only on sharp breakouts. Instead of breaking down under sustained pressure, the BTC price has spent several weeks consolidating at progressively higher levels, absorbing volatility rather than expanding it.
Historically, such phases have been risky for bulls. This time, however, the market structure looks different—and that deviation deserves close attention.
The Historical Pattern Bitcoin Usually Follows
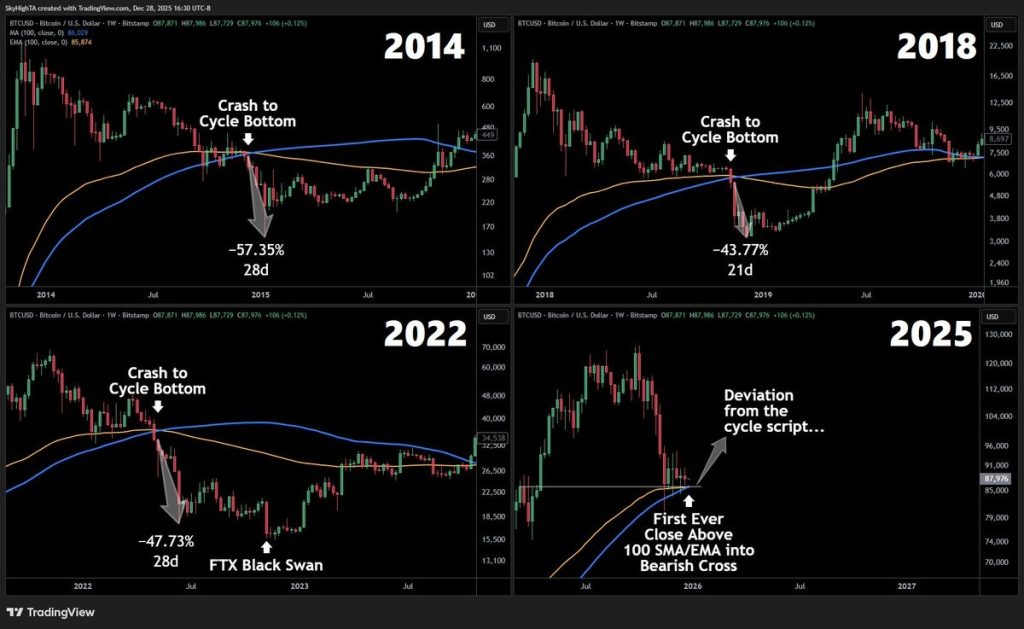
In previous bear markets—2014, 2018, and 2022 — Bitcoin followed a familiar script. Price closed below the 100-week SMA and EMA; those averages crossed bearishly, and within weeks, the market experienced a sharp 40% to 55% drawdown. That crossover did not mark the start of the bear market—it marked the final, most aggressive phase of it. In every prior cycle, the worst damage occurred shortly after this signal, flushing remaining late sellers before a longer recovery phase began.
Because of this history, traders continue to monitor the 100-week averages closely whenever Bitcoin enters a prolonged consolidation.
 Source: X
What’s Different This Time: The Pattern That Failed
The final weekly close of 2025 delivered something unprecedented. Bitcoin held above the 100 SMA and EMA at a moment when, in prior cycles, it decisively failed. More importantly, price did not follow through to the downside after briefly threatening a bearish crossover. This matters because failed bearish signals often reveal underlying strength. Instead of accelerating lower, Bitcoin stabilized, volatility compressed, and structure held. In simple terms, the market refused to break where it previously always did.
This does not automatically confirm a bull market—but it does invalidate a major historical bearish trigger.
Why a 40% Crash Is Becoming Less Probable
For a 40% crash to unfold from current levels, Bitcoin would need to lose multiple layers of support in quick succession, including a weekly close below the 100-week averages and acceptance beneath recent demand zones. None of those conditions is currently in place.
Momentum has slowed, but it has not flipped aggressively bearish. More importantly, selling pressure has failed to expand despite repeated tests lower. That combination shifts probabilities. A deep downside is no longer the default outcome—it would require a clear catalyst or a structural breakdown.
Compared to previous cycles, Bitcoin is consolidating at much higher price levels relative to its long-term averages. Dips are being bought faster, ranges are tightening rather than expanding, and volatility is compressing above key structural zones instead of below them. This is a notable change. In earlier bear phases, consolidation occurred after major breakdowns. This time, consolidation is happening without one.
What Traders Should What Next?
As highlighted earlier, the Bitcoin price has been consolidating above its recent gains for an extended period, a structure clearly visible on the 4-hour chart. The latest move saw BTC break above the symmetrical triangle, pushing the price toward the $90,500 zone—a key local resistance that has repeatedly acted as both support and supply in recent sessions. A sustained hold above this level is critical to preserve bullish momentum and confirm continuation.
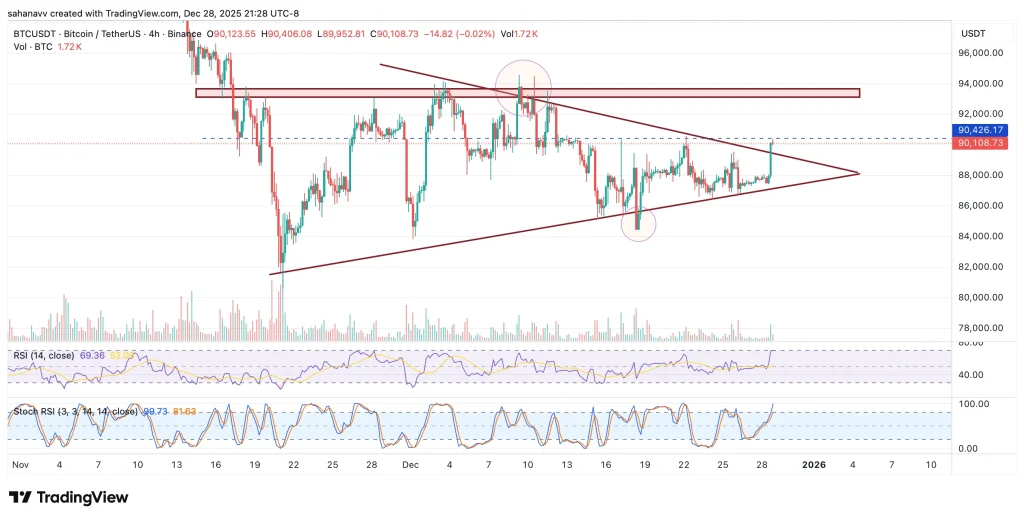
In the near term, momentum indicators suggest caution. Both RSI and Stochastic RSI have entered overbought territory, signaling rising short-term exhaustion. As selling pressure begins to emerge, Bitcoin could briefly slip below $90,000. However, if the former descending trendline of the triangle holds as support, a quick rebound remains likely. A pullback toward $89,500 could act as a demand retest, while failure to defend this zone may drag the price back inside the consolidation range.
If BTC stabilizes and later reclaims $90,500 with acceptance, a stronger breakout could follow, opening the door for an upside move toward the $93,000–$93,650 resistance band to start the new trading year.
Conclusion: Two Scenarios Going Into 2026
Bitcoin is approaching a technical turning point after weeks of consolidation. If the price holds above the former triangle trendline and secures acceptance above $90,500, bullish momentum could strengthen, opening the door for a move toward the $93,000–$93,650 resistance zone. Such a move would confirm a breakout and reinforce the broader strength seen on higher timeframes.
On the downside, continued selling pressure could drag the Bitcoin (BTC) price back below $90,000. A failure to defend the $89,500 support may push the price back into its consolidation range, extending sideways action and delaying any sustained upside breakout into early 2026.


 English (US)