
 3 hours ago
384
3 hours ago
384

The post Is This the Right Time to Buy Bitcoin?—Here’s What This Chart Suggests! appeared first on Coinpedia Fintech News
Bitcoin has been steadily pulling back after failing to hold above the $90,000 consolidation zone. Over the past few days, selling pressure has picked up, pushing the BTC price closer to an important support area. While the decline has been gradual rather than dramatic, the shift in momentum is noticeable, and short-term sentiment has turned cautious.
With the broader market looking to be entering a reset phase, many investors are starting to wonder what this move really means. Is this just a healthy pullback within a larger uptrend, or could it turn into a deeper correction? More importantly, does this dip offer a buying opportunity, or is it better to wait for clearer signs of stability before stepping in?
Bitcoin Sharpe Ratio Signals Potential Long-Term Opportunity
Bitcoin’s short-term Sharpe ratio has dropped to deeply negative levels, a zone that has historically aligned with major market bottoms. The Sharpe ratio measures risk-adjusted returns, and when it falls sharply into negative territory, it suggests that recent price action has delivered unusually poor returns relative to volatility.
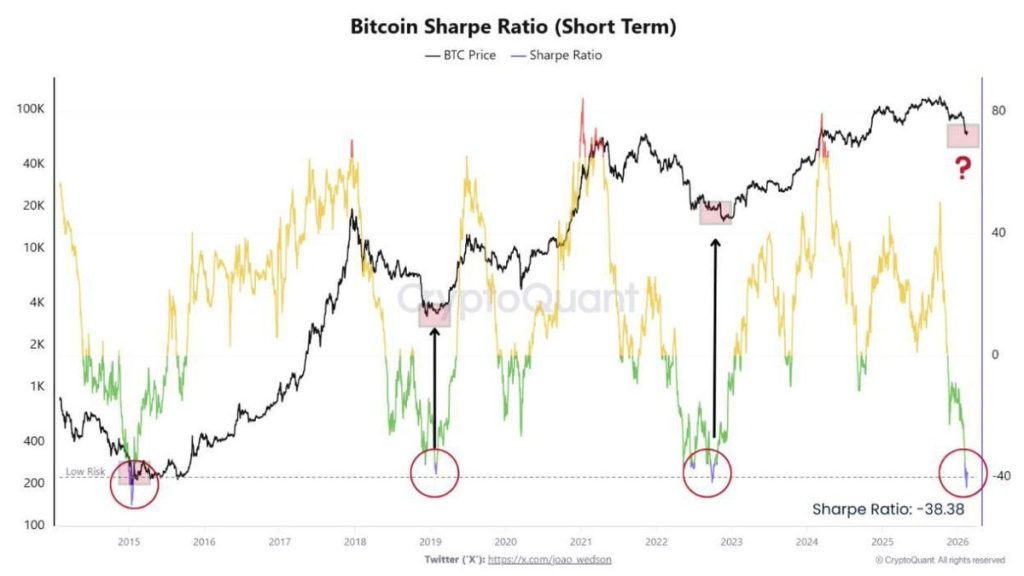
In past cycles, similar extreme readings appeared during periods of fear and heavy selling, often just before Bitcoin began strong recoveries to new highs. While no indicator guarantees an immediate reversal, these historically rare levels have coincided with what many consider “generational” buying opportunities. If history rhymes, the current reset phase could eventually lay the foundation for the next broader Bitcoin uptrend.
Is This the Right Time to Buy Bitcoin?
Bitcoin is currently hovering near its previous 2021 all-time high around $69,000, but momentum on both sides appears to be fading. Bulls have repeatedly attempted to push the price above $70,000, yet follow-through buying has been limited. At the same time, bears have struggled to force a decisive drop toward $65,000, keeping price action trapped in a narrow range.
This prolonged consolidation is creating uncertainty among market participants. Some investors are beginning to question whether Bitcoin has quietly transitioned into a broader bear phase or if this is simply a pause before the next major move. If downside pressure does intensify, the next key concern will be identifying where a sustainable bottom could form.
 Source: X
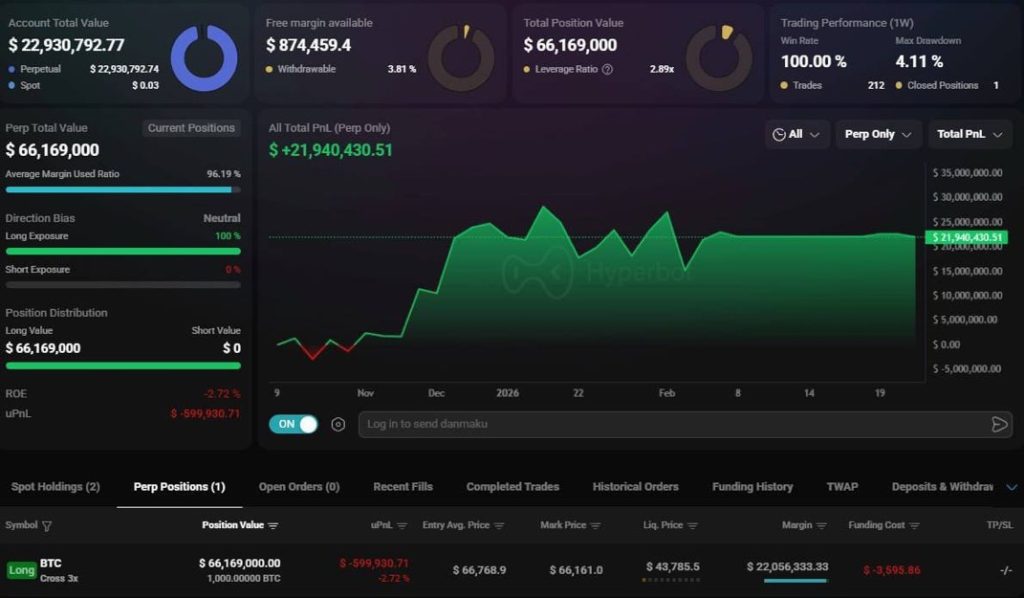
The latest data shows a whale opening a $66 million Bitcoin long position using 3x leverage, with a liquidation level near $43,785. The position is already sitting on roughly $22 million in unrealized profit, suggesting strong conviction behind the trade. If Bitcoin manages to hold its current range and build momentum, this setup could amplify upside volatility.
However, it’s also a bold move at a time when weekly candles are compressing near a major monthly order block, a zone that often triggers sharp reactions. While the whale appears confident in further gains, such aggressive positioning can increase volatility in both directions. If momentum weakens, leverage could accelerate downside pressure just as quickly as it fuels a rally.
Bitcoin at a Make-or-Break Level
Bitcoin (BTC) price is trading at a critical technical zone, and the next move could define the medium-term trend. A sustained push above $70,000 could open the path toward $74,000 and potentially retest the $80,000 region if momentum builds. However, failure to hold the $65,000 support may shift control back to sellers, exposing the $60,000 and possibly the $55,000 area.
With leverage building and volatility compressing, traders should expect a decisive breakout soon. Risk management remains essential as Bitcoin approaches this pivotal phase.


 English (US)