
 3 hours ago
656
3 hours ago
656

Key takeaways
- VeChain price projection suggests a peak price of $0.01052 by 2026.
- Traders can expect a minimum price of $0.01248 and a maximum price of $0.03285 by 2029.
- By 2032, VeChain’s price could potentially surge to $0.06428.
Despite occasional market volatility and significant regulatory uncertainties, VeChain demonstrates resilience and a strong value proposition, which is vital for the vechain ecosystem positioning itself as a leader in blockchain-based solutions for global supply chain, transparency, product authentication, and data management.
Overall, the prevailing sentiment within the VeChain community regarding the current market cap and the demand is one of optimism and confidence among investors, with stakeholders bullish on its long-term prospects and the transformative impact of blockchain technology. As the VeChain network continues to expand its reach and enhance its offerings, questions surrounding its price movements and trajectory persist, reflecting current trends, inviting further analysis and exploration of its future potential.
VeChain overview
| Cryptocurrency | VeChain |
| Symbol | VET |
| Price | $0.008031(-0.84%) |
| Market Cap | $690.55 Million |
| Trading Volume (24-h) | $17.4 Million |
| Circulating Supply | 85.98 Billion VET |
| All-time High | $0.2782, Apr 17, 2021 |
| All-time Low | $0.001678, Mar 13, 2020 |
| 24-h High | $0.00824 |
| 24-h Low | $0.007969 |
VeChain price prediction: Technical analysis
| Sentiment | Neutral |
| 50-Day SMA | $0.0100 |
| 200-Day SMA | $0.0166 |
| Price Prediction | $0.00793 (-2.17%) |
| F & G Index | 42.15 (fear) |
| Green Days | 10/30 (34%) |
| 14-Day RSI | 41.48 |
VeChain price analysis: VET falls to $0.0803
- VET falls to $0.0803
- Support is at $0.00790, with resistance at $0.00820 as the next key hurdle.
- Bearish signs suggest further decrease across the next few days.
VeChain (VET) current price analysis for February 18 shows significant decline across the month as the price fell below the $0.00800 mark before recovering. Today the price attempted to climb past $0.0824 but faced rejection falling back to $0.0803
VeChain 1-day price chart: VET falls to $0.0803
VeChain (VET) price action shows drop below the $0.00800 as the bears dominated the markets across the daily charts. However, after supports above $0.00800 crumbled across the last few days, the price found support at $0.00740 mark and made a swift recovery back to $0.00883. The following rejection caused another decline to the current $0.0803 mark.
 VET/USDT Price Chart: TradingView
The Relative Strength Index (RSI) rises to 40.91 showing bearish market sentiment as the price falls towards $0.00800. The indicator leaves room for volatile movement in either direction. Meanwhile, the Moving Average Convergence Divergence (MACD) shows falling bullish market momentum, with the MACD line at -0.00012. Moreover, the price volatility may increase if the price rises back above the $0.00800 mark.
VeChain 4-hour price chart: VET shows mixed momentum
VeChain (VET) live price trades at $0.00803 on the 4-hour chart, showing significant incline as VET falls from the $0.00820 level with a decrease of 0.84% over the last 24-hours.
 VET/USDT Price Chart: TradingView
The Relative Strength Index (RSI) stands at 42.06 showing bearish market sentiment while suggesting room for further downwards movement. The Moving Average Convergence Divergence (MACD), shows increasing bearish momentum at -0.00003. Overall, the indicators present bearish conditions across the 4-hour charts.
VeChain technical indicators: Levels and action
Daily simple moving average (SMA)
| SMA 3 | $ 0.009847 | SELL |
| SMA 5 | $ 0.009069 | SELL |
| SMA 10 | $ 0.008296 | SELL |
| SMA 21 | $ 0.008307 | SELL |
| SMA 50 | $ 0.01017 | SELL |
| SMA 100 | $ 0.01159 | SELL |
| SMA 200 | $ 0.01652 | SELL |
Daily exponential moving average (EMA)
| EMA 3 | $ 0.009004 | SELL |
| EMA 5 | $ 0.009687 | SELL |
| EMA 10 | $ 0.01043 | SELL |
| EMA 21 | $ 0.01090 | SELL |
| EMA 50 | $ 0.01205 | SELL |
| EMA 100 | $ 0.01441 | SELL |
| EMA 200 | $ 0.01808 | SELL |
What to expect from VET price analysis?
 VET/USDT Price Chart: TradingView
Vechain price analysis across the 4-hour chart shows a steady decay from the $0.008800 mark as VET observes a shift of momentum. The bears have crushed higher supports and the price suggests a fall below a key level at $0.00800.
Overall, Vechain suggests that the price may yet continue to rise towards $0.008200 if VET holds the $0.00790 level. However, in case of a trend reversal price may fall to $0.00740 again.
Is Vechain a good investment?
VeChain, as a notable blockchain project, stands out among crypto tokens in cryptocurrency because it focuses on supply chain management and enterprise solutions, which is not considered financial advice. It offers transparency and traceability across various industries, enhancing trust and efficiency in global trade.
With partnerships with major companies and a strong emphasis on real-world applications, many believe VeChain is a good buy due to its significant growth potential. Its innovative use cases and practical implementations appeal to businesses seeking operational improvements, making it an attractive option for informed investors.
However, it is advised to do your own research and conduct experts opinion before investing in the volatile market.
Why is VET down?
VeChain (VET) price shows that the bulls faced rejection above $0.0880 and the price has declined to the current $0.0803 mark.
Will VeChain recover?
VeChain has experienced a notable selloff in the last thirty days, with the price falling from near the $0.03 mark to its highest price of the period to the current $0.021 level. However, industry analysts suggest that this downturn in the financial markets may not be long-term, a sentiment shared by many VET holders. Most projections indicate that VeChain could regain strength as market conditions improve, with expectations for the asset to potentially close the year between the $0.035 and $0.05 price levels.
Will VeChain reach $0.05?
Analysts suggest VeChain could attain $0.05 by 2031, as the minimum price is projected to be $0.0434 and the average price at $0.0500, as per the VET price prediction 2031. with a potential peak of $0.0585.
Will VeChain reach $0.10?
VET is expected to trade above $0.10 by 2032, with the minimum price projected at $0.0977.
Does VET have a good long-term future?
VET has a good long-term future due to its strong use cases, growing on chain activity, and active development team at the Vechain Foundation.
Recent news/opinion on Vechain
Vechain’s ecosystem was recently featured in the GSTI Documentary hosted by CNBC
VeChain price prediction February 2026
In January 2026, the price of VeChain is anticipated to reach a minimum of $0.00592. The VET price can be expected to peak at $0.00856, maintaining an average of $0.00705 by the end of the month.
| Month | Minimum Price ($) | Average Price ($) | Maximum Price ($) |
| February | 0.00592 | 0.00705 | 0.00856 |
VeChain price prediction 2026
In 2026, the price of the VeChain coin is anticipated to touch a minimum of $0.00494, reflecting the current VeChain sentiment. The VET price might peak at $0.01052, maintaining an average of $0.00773by the end of the year.
| Year | Min. Price ($) | Average Price ($) | Maximum Price ($) |
| 2026 | 0.00494 | 0.00773 | 0.01052 |
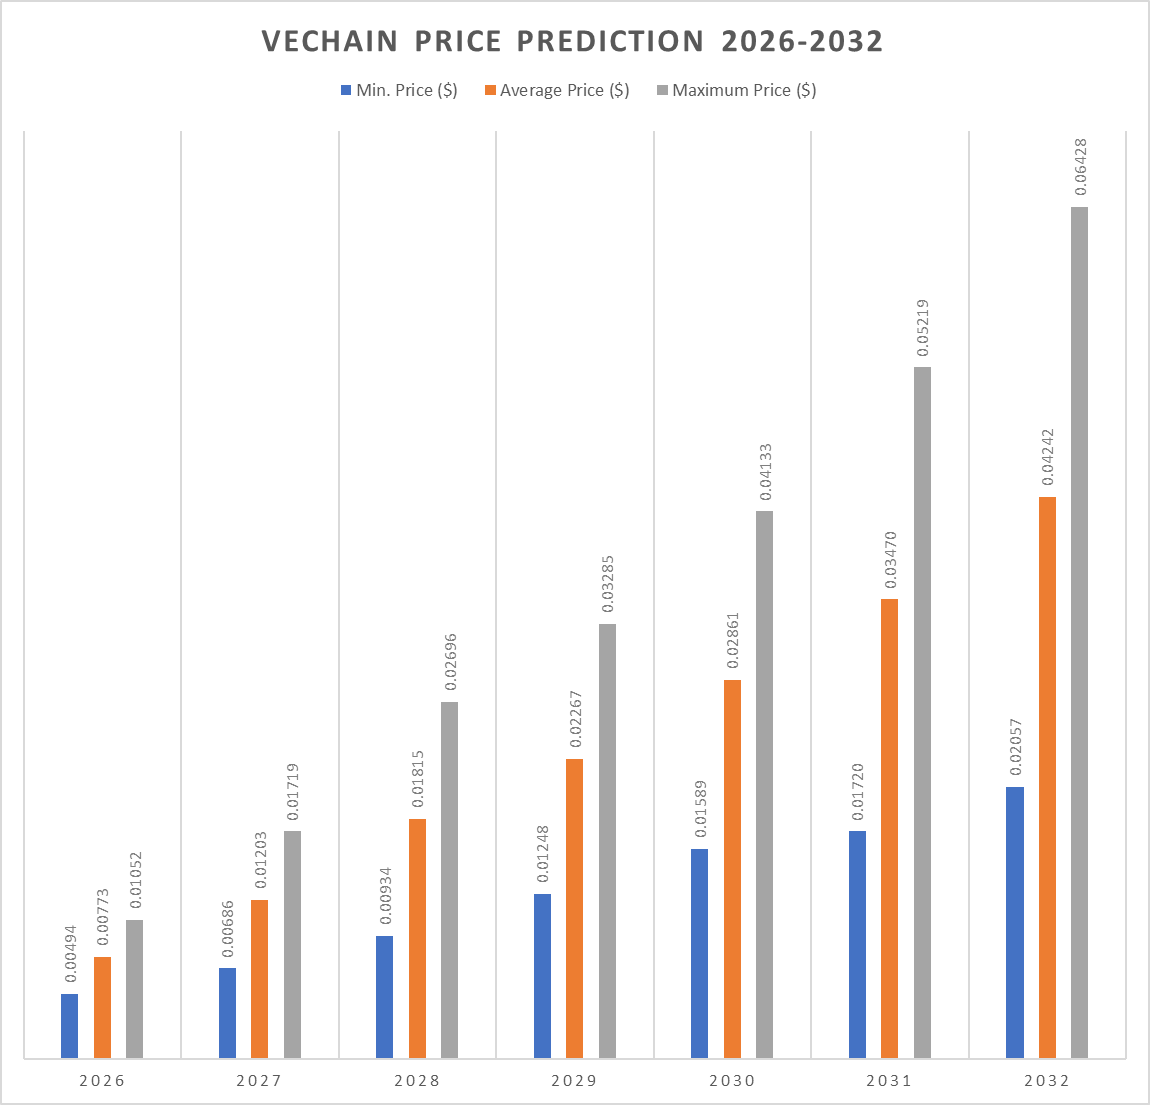
VeChain price prediction 2026-2032
| Year | Min. Price ($) | Average Price ($) | Maximum Price ($) |
| 2027 | 0.00686 | 0.01203 | 0.01719 |
| 2028 | 0.00934 | 0.01815 | 0.02696 |
| 2029 | 0.01248 | 0.02267 | 0.03285 |
| 2030 | 0.01589 | 0.02861 | 0.04133 |
| 2031 | 0.01720 | 0.03470 | 0.05219 |
| 2032 | 0.02057 | 0.04242 | 0.06428 |
VeChain Price Prediction 2027
For 2027, VeChain (VET) is expected to reach a minimum price of $0.00686. It could potentially climb to a high of $0.01719, averaging around $0.01203.
VeChain Price Prediction 2028
By 2028, VeChain price prediction is projected to trade at a minimum value of $0.00934. It might surge to a high of $0.02696, with an average price of $0.01815.
VeChain Price Prediction 2029
VeChain price prediction estimates VET to trade at a minimum of $0.01248 in 2029. It might reach a maximum of $0.03285, with an average value of $0.02267.
VeChain Price Prediction 2030
In 2030, VeChain’s price will likely hit a floor of $0.01589. Based on analysis, it could peak at $0.04133, with an average closing price of $0.02861.
VeChain Price Prediction 2031
The VeChain price prediction for 2031 projects a minimum price of $0.01720, a maximum price of $0.05219, and an average trading price of $0.03470.
VeChain Price Prediction 2032
In 2032, VeChain forecast suggests VET could trade at minimum and maximum prices of $0.02057 and $0.06428, respectively. The price might maintain an average of $0.04242.
 Vechain Price Prediction
Vechain Price Forecast: By Analysts
| Firm | 2026 | 2027 |
| Coincodex | $0.01498 | $0.01274 |
| DigitalCoinPrice | $0.0208 | $0.0291 |
Cryptopolitan’s VeChain (VET) price prediction
Cryptopolitan’s market analysis predictions show that VeChain will achieve a high of $0.01052 in 2026. In 2028, it will range between $0.00934 and $0.02696, with an average of $0.01815. In 2032, it will range between $0.02057 and $0.06428, with an average of $0.04242. Note that these predictions are not investment advice. Seek independent professional consultation or do your own research.
VeChain historic price sentiment

VeChain Price History
- VeChain began in 2015 as a private consortium chain for blockchain applications. It transitioned to a public blockchain with the ERC-20 token VEN in 2017 and launched its mainnet as VET in 2018.
- In 2018, VeChain partnered with DHL to develop blockchain solutions for logistics but saw a significant price correction, stabilizing at lower levels.
- The price remained relatively stable in 2019 and 2020, with occasional spikes as VeChain continued developing technology and forming partnerships.
- In 2021, VeChain’s price surged to an all-time high of $0.20 in May but dropped to $0.070 by December.
- In 2022, VeChain attempted to recover but remained below $0.10, with continued volatility throughout the year and into early 2023.
- Towards the end of 2023, the price saw a slight uptick, stabilizing around $0.020 by early 2024.
- In 2024, VeChain’s price fluctuated, recovering to $0.025 by mid-March but dropping due to bearish trends, reaching a low of $0.019 by August.
- It traded around $0.021 in September but ended the month above the $0.024 mark. The price remained mostly stable in October, with the occasional bearish movement causing a decline from the $0.02400 level to start November at the $0.02100 price level.
- The asset closed November at a high level, with prices near the $0.04600 mark and a strong bullish outlook. However, the bulls only took the price higher in December, as the $0.0500 resistance was crushed swiftly.
- As of January 2025, VET traded around the $0.04300 mark as it started and closed the month around the same level.
- In February, the price fell towards the $0.03000 mark as bears took over, ending the month at $0.02800. In March, the net movement was low, but the volatility was very high, as the price fell to $0.02200 where it closed the month.
- In April the price saw an initial crash but observed sharp recovery ending the month above the $0.02600 mark. In May the price dwindled again ending the month around $0.0250. In June the price continued to struggle as it dropped to $0.0200 to end the month.
- July saw a sharp rise to the asset’s volatility with VET crossing the $0.02800 mark. However, the price could not be maintained and VET ended the month around the $0.02200 level. In September, the price saw high volatility reaching as high as $0.0260 but failed to stay at the level and ended the month below the $0.02200 mark.
- In October, the price declined further and ended the month below the $0.01500 mark as bears dominated the crypto markets during the later half of the month. in November, the downtrend continued with VET ending the month below the $0.130 mark. In December, the price continued to move downwards ending the year at $$0.0122.
- In January, the trend continued with VET falling below the $0.0100 mark and ended the month below the $0.0080 level.


 English (US)